Effects of Crude Oil and Spill-Response-Options on Microbial Functions and Oil Disappearance in Salt March Soils: Year 2
John A. Nyman
Thomas E. McGinnis II
Department of Biology
University of Louisiana at Lafayette
Technical Report Series
99-007
DISCLAIMER
This report was prepared under a contract between the University of Southwestern Louisiana and the Louisiana Applied and Educational Oil Spill Research and Development Program (OSRADP). The contents of this document do not necessarily reflect the views and policies of the Louisiana Oil Spill coordinator's Office, Office of the Governor or that of the Louisiana Applied and Educational Oil Spill and Development Program, nor does mention of trade names or commercial products constitute endorsement or recommendation for use by the state of Louisiana.
REPORT AVAILABILITY
Additional copies of this report may be obtained by writing to:
Louisiana Applied and Educational Oil Spill and Development Program
1999 Deliverables
258 A/B Military Science
Baton Rouge, Louisiana 70803
Telephone Number: (225) 388-3477 Fax Number: (225) 388-0403
or from
The Louisiana Oil Spill Coordinator/Office of the Governor
Natural Resources Building
625 N. 4th Street, Room 800
Baton Rouge, Louisiana 70802
Telephone Number: (225) 219-5800 Fax Number: (225) 219-5802
CITATION
Nyman, J.A and T.E. McGinnis. 1999. Effects of crude oil and spill-response-options on microbial functions and oil disappearance in salt marsh soils: Year 2. Department of Biology, University of Southwestern Louisiana. Louisiana Applied and Educational Oil Spill Research and Development Program, OSRADP Technical Report Series 99-007
TABLE OF CONTENTS
- 1.0 Introduction
- 2.0 Previous Research
- 3.0 Research Needs
- 4.0 This Research Project
- 5.0 Methods
- 6.0 Results
- 7.0 Discussion
- 8.0 References
- 9.0 Tables
- 10.0 Figures
LIST OF TABLES
Table 1. Experimental design of research. Each cell contained duplicate soils from three different marshes for a total sample size of 144. Sampling frequency for soil Eh, CO2 emissions, and CH4 emission were Days 1, 3, 7, 14, 28 (4 weeks), 56 (8 weeks), 98 (14 weeks), 140 (20 weeks), and 168 (24 weeks)
Table 2. Field soil characteristics (mean + sd) of Spartina alterniflora and Juncus roemerianus dominated saline marsh from three distinct geologic regions of coastal Louisiana: Chenier Plain - Rockefeller Wildlife Refuge (CP); Inactive Deltaic - LUMCON Cocodrie, Terrebonne Bay (ID); Active Deltaic - Old Oyster Bayou (AD)
Table 3. Mean (standard deviation) of soil characteristics (mean + sd) from microcosms created with soil from three distinct geologic regions of coastal Louisiana: Chenier Plain - Rockefeller Wildlife Refuge (CP); Inactive Deltaic - LUMCON Cocodrie, Terrebonne Bay (ID); Active Deltaic - Old Oyster Bayou (AD)
Table 4. Loss of crude oils (percent weight) after weathering
Table 5. Carbon additions and emissions from microcosms to which crude oil was added and emissions were measured for 24 weeks
Table 6. Ranking of disturbance and hydrocarbon disappearance in saline marsh soils. Low rankings indicate more desirable effects; e.g., high hydrocarbon disappearance or low deviation from unoiled microcosms. Ties within a column indicate statistical similarity. The cumulative ranking is the product of the three factors evaluated: hydrocarbon disappearance, disturbance to microbial activity, and disturbance to soil Eh.
LIST OF FIGURES
Figure 1. Total petroleum hydrocarbons 24 weeks after adding treatments
Figure 2. Microbial activity in oyster grass marsh after adding oils and chemicals
Figure 3. Microbial activity in needle rush marsh after adding oils and chemicals
Figure 4. Cumulative carbon emissions from oiled oyster grass marsh microcosms
Figure 5. Cumulative carbon emissions from oiled needle rush marsh microcosms
Figure 6. Eh 0.5 cm below the soil surface before and after adding crude oils
Figure 7. Soil Eh before and after adding chemicals
Effects of Crude Oil and Spill-Response-Options on Microbial Functions and Oil Disappearance In Salt Marsh Soils: Year 2
Abstract
Physical responses to oil spills in marshes are unworkable because foot traffic can destroy soil structure and drive crude oil into anoxic soil where oil degradation is extremely slow. Thus, the best responses are natural attenuation or chemical responses such as: (1) dispersing oil before it reaches the marsh, (2) cleaning oil from fringing marsh (which is heavily utilized by wildlife), and/or (3) fertilizing oiled marsh. Although chemical additives offer great promise, they are unlikely to become widely used until the effects of oil and chemical mixtures on wetland ecosystems are understood. Hydrocarbons increase the abundance of hydrocarbon degrading microorganisms but also decrease microbial diversity. This effect could disrupt ecosystem dynamics by slowing soil organic matter mineralization and associated nutrient remineralization. To better quantify this problem, we compared hydrocarbon disappearance, soil Eh, and microbial activity among microcosms exposed to three different oiling scenarios (no oil, Louisiana Crude, or Alaskan Crude) and four different additive scenarios (no additive, fertilizer, cleaner, dispersant).
Oil disappearance was accelerated by the fertilizer (non-detectable) and the cleaner (4% of initial concentrations), but slowed by the dispersant (56% of initial concentrations) relative to no additives [i.e., natural attenuation (13% of initial concentrations)]. These effects applied to soils from both types of marshes studied: those dominated by Spartina alterniflora (oyster grass) and those by Juncus roemerianus (needle rush). However, microbial activity responded to the oils and additives differently in the two types of marshes. In the oyster grass marsh, fertilizer helped microbial activity recover by the end of the six month study. In the needle rush marsh, additives did not promote microbial recovery. In all instances, the disturbance was an acceleration rather than an inhibition of activity. In addition to toxins, crude oils evidently contain substances that stimulate activity of the surviving microbial community. It could not be determined if the additional activity resulted from consumption of crude oil or from consumption of soil organic matter. Crude oil temporarily lowered soil Eh. The lower Eh reflected accelerated metabolism and accelerated demand for electron acceptors.
A cumulative ranking based on oil disappearance and disturbance to microbial activity and soil Eh indicated that needle rush marshes are more sensitive than oyster grass marshes and thus should receive priority when booms are limited. The rankings also indicated that both plant types should be fertilized if oiled. If cleaners and dispersants are used, their benefits to other components of the ecosystem should outweigh their impact on oil disappearance, soil microbial activity, and soil Eh.
1.0 Introduction
Wetlands are an important part of riverine, estuarine, and coastal ecosystems. Oil is refined, stored, and/or transported through these areas, and some wetlands are therefore subjected to occasional spills. Oil has spilled directly into wetlands from pipelines (Mendelssohn et al. 1993) or washed into wetlands from adjacent rivers, bayous, or lakes (Alexander et al. 1979). Wetlands provide fish and wildlife habitat and can improve water quality (Mitsch and Gosselink 1984:393-414). Thus, there is great public interest in oil spills and response activities that affect wetlands.
Data accumulating in the technical literature indicate that some wetland plant species tolerate fouling with some crude oils (DeLaune et al. 1974; Smith et al. 1984; Pezeshki and DeLaune 1993; Pezeshki et al. 1995; Lin and Mendelssohn 1996). However, few data are available to evaluate the long-term effects of crude oil on wetland soil microbial functions. These functions include nutrient remineralization, which supplies nutrients to wetland vegetation and adjacent aquatic habitats, as well as soil Eh, which governs root stress on vegetation. Lack of information about the effects of crude oil on nutrient remineralization and soil Eh feeds fear that oil spills permanently degrade ecosystems. Previous researchers found that neither Louisiana nor Arabian Crude oils inhibited microbial metabolic activity in fresh marsh soils (Nyman 1999), but the resiliency of microbial communities has not been studied in saline marsh soils. Therefore, one goal of this project was to determine how microbial activity and soil Eh were affected by crude oil in saline marsh soils.
This project also compared the effectiveness of chemical additives at promoting the degradation of crude oils and maintaining natural levels of microbial metabolic activity and soil Eh. Physical responses to oil spills in Louisiana saline marshes were not evaluated. Foot traffic can destroy marsh soil and drive crude oil into the anoxic portion of the soil where bacterial degradation of the oil is extremely slow (DeLaune et al. 1980). Thus, the most likely response to oil spills in saline marshes is no response (natural attenuation) or chemical responses such as: (1) dispersing the oil before it reaches the marsh, (2) cleaning the oil from fringing marsh (which is heavily used by wildlife), or (3) fertilizing oiled marsh. The decision to leave crude oil for natural degradation can be criticized because of the promise offered by chemical additives, but chemical additives cannot become standard procedure until the effects of the different chemical/oil mixtures on wetland ecosystem function and oil degradation are understood. Thus, this research also determined the effectiveness of natural degradation and the three chemical responses at enhancing crude oil volatilization and biodegradation from saline marsh soils.
2.0 Previous Research
Understanding of the consequences of crude oil on soil microbes lags far behind our understanding of the consequences of crude oil on marsh vegetation even though consortia of bacterial species in marsh soils degrade oil and influence nutrient cycling, plant growth, and ecosystem functions. The microbial community regulates the flow of energy from plants to food webs (Knox 1986:111-112). Soil conditions, primarily soil Eh, directly control plant growth in marshes (Chalmers 1982; Good et al. 1982). Changes in soil water chemistry coincide with changes in soil Eh (Feijtel et al. 1988), and soil Eh has been used as indicator of stress on fresh, brackish, and saline marsh vegetation (DeLaune et al. 1983; Burdick et al. 1989; and McKee and Mendelssohn 1989). The soil microbial community also controls the release of nutrients from marshes to adjacent water. This continual nutrient release appears to maintain a rapid transfer of energy when demand is high, regardless of primary productivity (Knox 1986:111-112). The recovery of oiled vegetation may therefore depend partly on biodegradation rates and partly on how oil affects soil conditions. Oil may also have long-term effects on wetland functions even after plant growth resumes. Burns and Teal (1979) found oil in marsh soil seven years after one spill, which indicates the potential for long term effects. Thus, whereas short-term effects of oil spills in marshes are dominated by effects on plants (which are proving remarkable resilient), the long-term functioning of the wetland depends on how oil affects soil microbial processes.
More researchers have investigated the effects of petroleum hydrocarbons on bacteria living in sea water (e.g., Atlas et al. 1991; DeLille and Siron 1993; Karl 1992) than on bacteria living in marsh soils probably because oil spills are more likely to affect open water than wetlands. Although valuable to understanding marine ecosystems, the results of those water column studies shed little light on the effects of crude oil on wetland ecosystems because marsh soil bacteria consortia are composed of different bacterial species than those found in sea water. Furthermore, bacteria are more important in wetland ecosystems than in open water ecosystems because wetland soil bacteria support two to three times more production than water column bacteria (Moran and Hodson 1992).
Studies involving crude oils and soil microbes have generally focused on the presence or absence of soil microbes rather than on their levels of activity. Some researchers found no or little effects of oil on soil microbial abundance (DeLaune et al. 1979; DeLaune et al. 1984). Other researchers have found adverse effects of oil on abundance of soil organisms (Bender et al. 1977; Alexander and Shwarz 1981; Sanders et al. 1980).
Only two previous studies attempted to determine effects of hydrocarbons on marsh soil microbial functions. Li et al. (1990) found that high levels of a mixture of 10 hydrocarbons inhibited microbial respiration and nutrient remineralization in saline marsh soils, but low levels of the hydrocarbon mixture stimulated microbial activity. That study did not use crude oil and used only one type of saline marsh soil, oyster grass soil. The results of the Li et al. (1990) study cannot be extended directly to all saline marshes because: (1) crude oils probably vary in toxicity from the 10 hydrocarbon mixture used in that study, and (2) many saline marshes are dominated by needle rush rather than oyster grass. Nyman (1999) found that Louisiana Crude and Arabian Crude temporally stimulated microbial metabolic activity and lowered soil Eh in fresh marsh soils. Nyman and Patrick (1995) showed that chemical cleaners or dispersants may have accelerated hydrocarbon disappearance. The results of that fresh marsh investigation cannot be extended to saline marshes because: (1) saline marsh soil bacteria may respond differently than fresh marsh soil bacteria to crude oil and chemical response options, (2) saline marsh soil bacteria are unlikely to be exposed to fresh water dispersants, and (3) saline marsh soils naturally contain more nutrients than fresh marsh soils (thus, fertilization may not be needed in saline marshes). No previous attempt has been made to assess the relative sensitivity of the two most common saline marsh soils to crude oils, chemical dispersants, or chemical cleaners, which was the goal of this investigation.
Oil can have dramatic effects on Eh when it prevents oxygen from entering the water (DeLaune et al. 1979), but there are no data available to determine the effects of less than total oil coverage on soil Eh. Documented effects vary, primarily because trampling and vegetation death also affect Eh, and probably because different oils have different levels of toxicity and hydrocarbon substrates, which serve as energy sources for soil bacteria. Only the Nyman (1999) study measured the long-term, (i.e., six month) effects of crude oil and chemical responses on soil Eh without confounding effects of vegetation death and trampling. That study was, however, conducted on fresh marsh soils. The results from those fresh marsh studies cannot be extended to saline marshes because Nyman and DeLaune (1991) showed that the response of microbial respiration and soil Eh to hydrological factors varies among the marsh types. It is therefore likely that the response of microbial activity and soil Eh to crude oil and chemical additives also varies among the marsh types.
Jackson et al. (1996) did not study the effects of crude oil on soil microbial processes per se, but they collected relevant data when they tested the feasibility of using the stable carbon isotope ratio of CO2 produced by soil bacteria as a means of assessing crude oil remineralization. They noted that addition of crude oil did not stimulate CO2 emissions in S. alterniflora marsh soils and that fertilization increased mineralization during the seven week field study. The effects and effectiveness of dispersants and chemical cleaners was not assessed, nor was J. roemerianus soil used or soil Eh monitored. Furthermore, fertilization studies in other environments indicate that fertilizer might not be cost effective if long-term, natural mineralization rates are considered (EPA 1991).
Release of CO2 by soil bacteria has been proposed as a method of monitoring bioremediation (Swannell et al. 1994), but Nyman (1999) found that increased CO2 emissions following the addition of crude oil can result primarily from stimulated consumption of in situ soil organic matter. Thus, the proposed measurements of CO2 cannot be used to compare crude oil remineralization among the treatments.
3.0 Research Needs
The lack of data describing the effects crude oils and chemical response options on soil microbial metabolic activity feeds fears that crude oil spills permanently degrade ecosystems. Furthermore, response coordinators do not have enough data to assess the relative sensitivity of different plant types to crude oils or chemical responses. Important questions are: how sensitive are saline marsh soil bacterial systems to oil? How are soil microbial processes in saline marshes affected by dispersants and cleaners? Is the biodegradation rate increased, decreased, or unaffected by chemical responses? How are other important soil processes that control plant growth and ecosystem function affected by oil and chemical responses? Do the most common crude oils in Louisiana affect saline marsh similarly or differently?
4.0 This Research Project
We initiated a two year research project in June, 1997. The purposes of this project were:
-
- to determine which response strategy (no action, application of cleaners, application of dispersants, application of nutrients) resulted in the greatest evaporation and biodegradation of crude oil in saline marsh soils;
- to determine which response strategy (no action, application of cleaners, application of dispersants, application of nutrients) least impacted soil microbial metabolic activity and soil Eh in saline marsh soils; and
- to determine the relative sensitivities of soil microbial processes in the two most common saline marshes, Spartina alterniflora or Juncus roemerianus, to Alaskan North Slope and South Louisiana Crude oils.
The experimental design for this project was a three by four by two factorial with blocking on site (Table 1). The three oil treatments were no oil, South Louisiana Crude, and Alaskan North Slope Crude. The four response treatments were no response, addition of nutrients to oiled marsh, fouling of marsh with dispersed oil, and fouling of marsh with cleaned oil. The two soils used were Spartina alterniflora (oyster grass) soil and Juncus roemerianus (needle rush) soil. The dispersant used was COREXIT 9500; the cleaner used was COREXIT 9580. Physical responses were not considered because, as noted above, they are not likely to be attempted in Louisiana saline marshes. Different oils were studied because oils differ in toxicity. A common crude oil in coastal Louisiana is South Louisiana Crude. Daily production averaged 384,836 bbls/day from 1985 to 1989 (La. DNR 1991). Nearly six times as much oil is refined in Louisiana as is produced, and a leading supplier of imported oil to PAD District III (which includes Louisiana) is currently Alaska. Thus, this study used South Louisiana Crude and Alaskan North Slope Crude oils.
Different soils were used because saline marshes are not homogeneous. Chabreck (1970) found that most saline marshes were dominated by either Spartina alterniflora (oyster grass) or Juncus roemerianus (needle rush). Different plant species respond differently to environmental factors, and different species dominate different areas depending on variations in nutrient, soil, and hydrological factors. Thus, although both oyster grass and needle rush marshes are saline, they are distinctly different marshes associated with different soil and water chemical conditions. As well as dominating in Louisiana (Chabreck 1970), these two species also dominate coastal saline marshes in the southeastern United States (Mitsch and Gosselink 1984:173-207), or about 80% of the coastal saline marshes in the lower 48 states. Thus, the results from this study may be directly applicable to about 80% of the coastal saline marshes in the lower 48 states.
When combined with information from previous workers on the relative sensitivity of different plant species to crude oils, the information provided by this study can be used to guide on-scene coordinators who must decide whether to disperse, clean, fertilize, or leave for natural biodegradation oils spilled into or moving towards Louisiana’s saline marshes.
5.0 Methods
Microcosms are a valid and efficient way of examining factors affecting soil bacteria (Bolton et al. 1991; Kroer and Coffin 1992), and it is unlikely that the expense of field studies could be supported at this stage of investigation. Thus, this experiment used microcosms consisting of marsh soil (approximately 300 ml) in 500 ml Erlenmeyer flasks. Soils from three sites were collected in order to make the microcosms. The three sites occupied different geologic settings. Site One soils were collected 24 July, 1997 from the Chenier Plain at Rockefeller Wildlife Refuge. Site Two soils were collected 20 August, 1997 from the Inactive Deltaic Plain in Cocodrie at LUMCON. Site Three soils were collected 21 November, 1997 from the Deltaic Plain at Four League Bay. Although in the Inactive Delta Plain, Site Two receives fresh water and sediment from the Atchafalaya River each spring.
Within each marsh, two 15 cm diameter cores were collected from an area dominated by oyster grass, and two from an adjacent area dominated by needle rush. These cores were returned to the lab and the upper 36 centimeters were used to characterize field soils (Table 2).
Within each marsh, separate bulk samples were collected from oyster grass and needle rush dominated areas. Bulk soil was collected from the upper 30 centimeters, placed in covered plastic tubs, and returned to the lab. Each bulk sample was homogenized by manually stirring and cutting with a serrated knife. All soils converted from firm peat to pastes following destruction of the living root network; deionized water was added as needed to create pastes.
After allowing the soils to equilibrate to lab conditions in the tubs, approximately 300 ml of soil were placed in clean, preweighed and numbered 500 ml Erlenmeyer flasks. The microcosms were then reweighed to determine the mass of soil paste added. The flasks were wrapped in foil to prevent algae from growing below the soil surface on the sides of the flasks. The flasks were unsealed, which allowed a surface oxidized layer to form on the soils. This layer is a natural characteristic of marsh soils (Mitsch and Gosselink 1984) and where the bulk of biodegradation occurs (DeLaune et al. 1980; Hambrick et al. 1980). Forty-eight flasks from both plant types were prepared from Sites One and Two; 24 flasks from both plant types were prepared from Site Three. In all there were 240 microcosms. Twenty-four of the microcosms from Site One and 24 from Site Two were used to study microbial activity and soil Eh. The remaining soil from the sites was used to characterized hydrocarbon content at the start of the experiment.
Three 50 ml subsamples of both soil pastes were placed in preweighed containers, weighed wet, dried at 100 °C, and reweighed to determine the bulk density of microcosm soil. The organic matter content of the samples was determined using a subsample, which was dried via combustion at 400 °C for 12 hours (Davies 1975). The samples were processed to determine the soil characteristics of the microcosm soils (Table 3).
Treatment solutions were mixed in 1,000 ml glass beakers. The nine treatments for both soils are indicated in Table 1. Louisiana Crude (100 ml), Alaskan North Slope Crude (100 ml), dispersed oil (100 ml oil and 20 ml COREXIT 9500), and cleaned oil (100 ml oil and 20 ml COREXIT 9580) were weathered in 1,000 ml beakers containing 300 ml of deionized water. Both beakers were continuously stirred under a fume hood overnight (16 hours). This degree of weathering was mild relative to that typically used in previous studies, which generally used ultraviolet light and heat. Approximately 13% of the crude oils was lost during weathering; dispersants greatly increased this amount (Table 5). After weathering, oil and water fractions were separated with a separatory funnel and stored separately in amber glass jars until they were applied to the microcosms. Water and oil fractions were separated so that the oil:water ratio added to microcosms could be precisely replicated.
Treatments were applied over a two month period because of the large number of microcosms. Two millimeters of oil fraction (1.8 g) and 6 millimeters (6 g) of the water fraction were added to the appropriate microcosm. This oil:water ratio maintained the 1:3 ratio used during weathering. In addition, this volume of oil was added because preliminary trials indicated that it covered approximately 75% of the surface area in similar flasks containing similar amounts of soil. Expressed on an aerial basis, the oiling rate was approximately 3.5 l/m2 (320 g/m2). Complete coverage of water with 4 mm of oil resulted from applying 4 l/m2; higher rates simply increased the thickness of the oil layer. The fertilizer solution was Shultz 10-15-10 All Purpose Plant Food Plus. Fertilizer was applied at a rate equivalent to 40 g N/m2, 60 g P/m2, and 40 g K/m2. Fe, Mn, and Zn were also present in trace amounts. This rate was chosen because the nitrogen loading rate was within the range recommended for commercial rice fields in south Louisiana. For microcosms receiving cleaner or dispersant but no oil, 0.4 ml of chemical in 10 ml of deionized water were added. Immediately after treatments began, one microcosm from each treatment was refrigerated. The microcosms were stored until they were analyzed to determine hydrocarbon content (described later).
The best and most easily measured index of gross metabolic activity of mixed microbial populations in soil is CO2 emissions (Stotzky 1997). However, CH4 can also be an important avenue of C emissions in wetland soils; thus, both were measured. The detectors on the GC were calibrated for measuring CO2 (TCD detector) and CH4 (FID detector). Activity was measured on or about Days 1, 3, 7, 14, and 28, and two, three and a half, five and six months after treatments began. Microcosms were sealed with airtight caps equipped with septa on measurement days. Immediately after sealing, the time was recorded and a 0.25 ml air sample was withdrawn for determination of CO2 and CH4 concentrations in the headspace gas. After one to two hours, another 0.25 ml sample was withdrawn from the microcosm, and the exact elapsed time was recorded. CO2 and CH4 emissions were determined from changes in CO2 and CH4 concentrations, the elapsed time, and the headspace volume. Microcosms were unsealed after the second air sample was analyzed.
Soil Eh was measured with platinum electrodes (Faulkner et al. 1989). We had initially planned to measure Eh on Days 1, 3, 7, 14, and 28, and two, three and a half, and five months after treatments began, but we concluded that too much oil was sticking to the electrodes and being lost from the microcosms. Therefore, Eh was measured two weeks before applying oil, and one, three, and 24 weeks following treatment additions. Soil Eh was measured in microcosms at 0.5 cm, 1.5 cm, and 3 cm below the soil surface. Electrodes were inserted into the soil and allowed to equilibrate >15 minutes prior to both measurements (de la Cruz and Hackney 1989). Since measuring Eh disturbs the soil, this measurement was taken after CO2 and CH4 samples were collected.
Total petroleum hydrocarbon (TPH) concentrations were measured in soils from Sites One and Two. As indicated in Table 1, soils treated with cleaner only, dispersant only, and fertilizer only were not analyzed with GC/FID. TPH concentrations were not determined in soils from Site Three to reduce costs. Thus, 72 samples were analyzed via GC/FID.
All glassware used during the hydrocarbon extractions was washed with hot soapy water, rinsed in an 5% acid bath, rinsed in deionized water, and then rinsed with pesticide-grade dichloromethane (DCM). Hydrocarbon extraction began by adding enough distilled deionized water to create a soil slurry. Approximately 100 g of slurry were added to pre-weighed 250 ml teflon lined, wide mouth centrifuge bottles. The mass of the sample was then recorded.
Hexamethylbenzene in hexane was added to serve as an internal standard for analyses of total petroleum hydrocarbons via GC-FID. Internal standards were added in a cold room to reduce carrier evaporation during delivery. Preparation of HMB solution was as follows: Hexamethyl Benzene (HMB) Standard (95+% purity, Ultra Scientific, North Kingstown, RI) was dissolved in hexanes (Fisher, Fair Lawn, NJ). 62.6 mg (626 ppm) or 62.7 mg (627 ppm) of HMB Standard were dissolved in cold hexanes (final volume of 100 ml). One milliliter of HMB (0.626 mg/ml or 0.627 mg/ml) was then added.
After the internal standard was added, approximately 39 ml of GC resolve grade DCM were added, and the centrifuge bottle was immediately sealed. This volume of DCM was used because trials indicated that recovery fell below 90% if less DCM was used. Recovery only slightly improved even if only 50 ml of DCM were used. Deionized water was then added until the bottle was approximately 2/3 full. Water was added to insure that the DCM separated from the heavy clays.
The sealed centrifuge bottles were placed on an L.E.D. orbital shaker (Lab-Line Instruments, Inc.; Melrose Park, Il) for >14 hours. The shaker was set at approximately 180 revolutions/min. The samples were then centrifuged at 3,000 rev/min for six minutes at 4 °C using a Sorvall RC-5B Refrigerated Superspeed Centrifuge (DuPont Instruments, Newtown, Ct). After centrifuging, the DCM fraction was pipetted from underneath the soil and poured through a funnel containing glass wool and NaSO4; this was done to remove water and particulate matter. Extracts were sealed and refrigerated until analyses at LSU’s Institute for Environmental Studies could be performed.
Metabolic activity and Eh data were analyzed as an analysis of variance with a three by four factorial (three oils: no oil, LA Crude, AK Crude; four additives: no additive, fertilizer, dispersant, cleaner) with repeated measures over time (Steele and Torrie 1980). Metabolic activity data were square root transformed to improve compliance with assumptions of parametric statistics. Eh data did not require transformation and were analyzed as above but separately for both depths. Cumulative carbon emissions did not require transformation and were analyzed as three by four factorial (three oils: no oil, LA Crude, AK Crude; four additives: no additive, fertilizer, dispersant, cleaner). A transformation to normalize TPH data could not be found, but all three variables analyzed (raw data, log transformed, and square root transformed) indicated the same conclusions. Untransformed data were reported.
Effectiveness was ranked on the basis of TPH disappearance after six months combined with impacts on soil microbial processes. The response options were ranked from one to four with respect to TPH disappearance. The response option with the greatest petroleum hydrocarbon disappearance was ranked Number 1, and the response option with the least petroleum hydrocarbon disappearance was ranked Number 4. The response options were also ranked according to impacts on soil organic matter mineralization. Controls were ranked Number 1, the response option with the least deviation from control was ranked Number 2, and the response option with the greatest deviation from control was ranked Number 4. Rankings were also based on soil Eh. An overall effectiveness ranking was calculated from the product of the disappearance ranking, the soil organic matter remineralization ranking, and the soil Eh ranking. The option with the lowest overall ranking was designated the most effective.
6.0 Results
Organic matter content in the microcosm soils ranged from 10% to 17 and averaged 13% in the S. alterniflora soil and 12% in the J. roemerianus soils. Bulk density was approximately 20% lower in the microcosm than in the field (Tables 2, 3).
At the start of the experiment, analyses indicated more TPH in the needle rush soils than in the oyster grass soils (F1,27 = 6.27, P = 0.0186). TPH averaged 59,569 ppb (+ 5,256) in needle rush soils and 42,087 (+ 5,256) in oyster grass soils. No other differences were found.
At the end of the experiment, analyses indicated that TPH varied among the additives (F3,27 = 4.24, P = 0.0141) but not among other effects. The dispersant slowed TPH disappearance, but the fertilizers and perhaps the cleaner accelerated TPH disappearance (Figure 1). Assuming an initial concentration of 50,828 ppb (from all time 0 samples), the portion of TPH that disappeared ranged from 100% with fertilizers, to 56% with the dispersant. Cleaners reduced TPH to 4% of initial concentrations and natural attenuation (i.e., no additives) reduced TPH to 13% of initial concentrations within five months.
Significant differences were detected in the way that activity changed over time among the different combinations of oil, additives, and plant species (F120, 1026 = 1.38, P = 0.0067). Soils from the two plants were analyzed separately because of the complexity of this interaction. Activity was not compared further between the two plant species other than to note that activity averaged 10.9 mg C/day (+ 0.2) in flasks containing J. roemerianus soils, and 11.5 mg C/day (+ 0.2) in flasks containing S. alterniflora soils.
In oyster grass soils, activity changed over time differently among the combinations of oils and additives (F48, 510 = 1.72, P = 0.0026). Both crude oils stimulated activity, but the outcome varied among the additives. In soils that received the fertilizer, activity was initially stimulated but did not differ between oiled and unoiled soils by the end of the study (Figure 2). However, when no additive was used and when the dispersant and cleaner were used, activity was faster in oiled soils than in unoiled soils throughout the study (Figure 2). Thus, microbial activity in oyster grass soils recovered within 24 weeks only if fertilizer was applied.
In needle rush soils, variations in activity did not change over time among the combinations of oil and additives (F48, 514 = 1.28, P = 0.1044) as it did in the oyster grass soils. Instead, activity changed differently over time among the oils (F16, 562 = 2.05, P = 0.0094). Activity was initially similar, but within a week of receiving oils, activity was faster in the oiled soils than in the unoiled soils (Figure 3). Accelerated activity persisted throughout the remainder of the study in oiled soils regardless of whether or not additives were used (Figure 3). Activity also changed differently over time among the additives (F 24, 562 = 19.78, P = 0.0001). Soils receiving additives initially had faster activity than soil that received no additives, but by the end of the study there was no difference between soils that received additives and those that did not (Figure 3). Thus, microbial activity in needle rush soils did not recover within 24 weeks regardless of the additive used.
Activity and CO2 emissions were correlated (R = 0.96727, n = 1244, P = 0.0001). Therefore, CO2 emissions were not considered independently after this point. Carbon emitted as CH4 also varied as did activity, and CH4 emissions and activity were correlated (R = 0.32160, n = 1244, P = 0.0001). Carbon emitted as CH4 was therefore not considered independently after this point.
Cumulative C emissions differed between oyster grass marsh and needle rush marsh. In oyster grass marsh, the fertilizer plus oil and the dispersant plus oil accelerated cumulative C emissions (Figure 4). But in the needle rush marsh, only fertilizer plus oil accelerated emissions (Figure 5). The additional amount of C emitted from oiled microcosms was less than the amount of C added as petroleum hydrocarbons (Table 5).
The response of soil Eh to crude oil varied over time only at the surface (F6,310 = 2.62, P = 0.0170). Crude oils did not initially affect soil Eh, but after six months, Eh was lower in oiled microcosms than in unoiled microcosms (Figure 6). The response of soil Eh to the additives varied over time at all depths: 0.5 cm (F9,310 = 4.67, P = 0.0001), at 1.5 cm (F9,314 = 5.28, P = 0.0001), and at 3.0 cm (F9,314 = 2.77, P = 0.0039). Initially, all additives lowered Eh, but by the end of the experiment, fertilizer caused higher Eh. In addition, the cleaner and dispersant caused lower Eh than occurred with no additives (Figure 7). There was no interaction between oil and additives on Eh at any depth: 0.5 cm (F18,310 = 0.72, P = 0.7951), at 1.5 cm (F18,314 = 0.77, P = 0.7379), and at 3.0 cm (F18,314 = 0.60, P = 0.8960).
Rankings based on TPH disappearance and disturbance to metabolic activity and soil Eh indicated that fouling of oyster grass is preferable to fouling of needle rush marsh (Table 6). Thus, when booms are limited, they should be deployed around needle rush marshes first if both marsh types are present. Rankings also indicated that adding fertilizers is preferable to natural attenuation, and natural attenuation is preferable to using the cleaner or the dispersant (Table 6).
7.0 Discussion
It is unlikely that the differences in TPH between the plant types at the beginning of the study resulted from systematic error in the application of oil to the microcosms. Instead, we suspect that these differences resulted from the long storage time between addition and extraction of the oil. We had intended to freeze samples at the start of the experiment, but the samples were refrigerated instead. Microbial degradation was thus slowed rather than restricted. It is therefore possible that the difference in TPH between the plant types in the early samples resulted from faster microbial degradation in the oyster grass marsh than in the needle rush marsh. If measurable TPH disappeared while the microcosms were refrigerated, then we underestimated the percent of TPH that disappeared during the five months because we underestimated the initial TPH concentration.
Two findings (that the dispersant slowed hydrocarbon disappearance, and that the fertilizer accelerated hydrocarbon disappearance from saline marsh soils) differ from similar work in fresh marsh soils (Nyman and Patrick 1995). In that study, TPH determined gravimetrically was lower in microcosms receiving the cleaner and the dispersant than in microcosms receiving the fertilizer or no additive. Target hydrocarbon concentrations did, however, vary among the additives. We do not know why the two study results differ. The differences in TPH among the additives may be ecologically irrelevant because Klerks and Nyman (in press) found that various measures of hydrocarbons, including TPH identified by GC-FID, were poorly suited for ranking toxicity. It therefore cannot be reliably concluded that the toxicity was lower when TPH was less concentrated. The TPH data were used for ranking purposes nonetheless.
Soil respiration was not inhibited by crude oil or response action scenarios. Lack of inhibition at the community level implies either a lack of toxicity at the species level or that community level activity was maintained by tolerant species with metabolic versatility. Numerous observations that crude oil reduced microbial numbers or diversity in sea water and terrestrial soils (Alexander and Shwarz 1981; Atlas et al. 1991; Baldwin 1922; Sanders et al. 1980), and invertebrate abundance (Bender et al. 1977) suggest that lack of toxicity was unlikely. It therefore appears that activity was maintained by tolerant species with metabolic versatility, and that these species occupied any niches vacated by other, sensitive species.
Respiration was not only maintained, but was also stimulated by crude oil. Stimulation persisted throughout the 24 week experiment in all oiled microcosms, except oyster grass soils that also received the fertilizer. Apparently, the fertilizer allowed faster microbial consumption of hydrocarbons such that fertilized microbial communities recovered from the disturbance by the end of the study. Stimulation of microbial metabolism by crude oil is consistent with previous work. Previous researchers have noted increases in soil respiration in response to additions of organic matter (Dicker and Smith 1985; Kludze and DeLaune 1995; Tate 1980) and hydrocarbon mixtures (Alexander and Schwarz 1980; Li et al. 1990). It is not known why the disturbance effect persisted >24 weeks in these saline marsh soils but not in a similarly designed study of fresh marsh soils (Nyman 1999). The different responses of the microbial communities in the two plant types indicate that needle rush marshes are more sensitive to crude oil than oyster grass marshes. Comparison of these results to a similar study using fresh marsh soils indicates that microbial communities in saline marsh soils are more sensitive to crude oil than microbial communities in fresh marsh soils. Microbial communities in fresh marsh soil recovered within 24 weeks regardless of which additive was used (Nyman 1999).
It could not be determined if the increase in metabolic activity was fueled by microbial consumption of soil organic matter or petroleum hydrocarbons. A similarly designed study of fresh marsh soils found that accelerated microbial activity was fueled primarily by consumption of soil organic matter (Nyman 1999). In this study, however, it is possible that the additional activity resulted entirely from the consumption of petroleum hydrocarbons. Reasons for such different responses between fresh and saline marsh soils are unknown.
It is highly unlikely that the gradual decline in soil Eh in the presence of hydrocarbons resulted from a gradual reduction in oxygen infusion. This is so because oil did not completely cover the surface even at the beginning of the experiment. Instead, soil Eh was probably lowered by the greater microbial activity, which would have increased demand for electron acceptors in oiled microcosms. It is not clear how the fertilizer increased soil Eh. Part of this increase could have resulted from the disappearance of TPH, but that would not explain why soil Eh was higher in fertilized microcosms than in unoiled microcosms. Perhaps the increase in Eh resulted from the growth of soil fungi, which create hyphae that carry oxygen into otherwise anoxic soil (Padgett and Celio 1990).
The rankings indicate that needle rush marshes should be protected before oyster grass marshes, and that fertilizers should speed recovery of the microbial community and may accelerate TPH disappearance. Because the rankings ignore costs and benefits other than the factors evaluated in this experiment, these recommendations should be used as guides rather than as rules. For instance, the cleaner has been shown to reduce plant mortality under some circumstances (Fiocca et al. 1991), and that benefit may be better valued than the impact that the cleaner has on soil Eh. Another similar, important example is that dispersants may reduce the area exposed to high concentrations of oil but increase the areas exposed to low concentrations of oil. Dilution, which is a primary benefit of dispersants, was not evaluated in this experiment. These rankings would only be slightly affected by the finding that TPH has little ecological value (Klerks and Nyman in press) because the only change would be no difference between the cleaner and the dispersant. Another factor to consider is that fertilizer addition could contribute to eutrophication. Study of the responses of vegetation in oyster grass and needle rush marshes found that oyster grass was more sensitive to crude oil than needle rush. However, the disturbance was relatively short lived (Pezeshki and DeLaune 1993). Priority should be given to the microbial community because it is less resilient than the plant community.
8.0 References
- Alexander, S.K., and J.R. Schwarz. 1980. Short-term effects of South Louisiana and Kuwait Crude oils on glucose utilization by marine bacterial populations. Applied and Environmental Microbiology. 40:341-345.
- Alexander, S.K., and J.W. Webb, Jr. 1985. Oil in the salt marsh: What have we learned? In: C.F. Bryan et al. (eds.), Proceedings of the Forth Coastal Marsh and Estuary Management Symposium. Louisiana State University Printing Office: Baton Rouge, Louisiana, pp. 49-62.
- Alexander, M.M, P. Longabucco, and D.M. Phillips. 1979. The impact of oil on marsh communities in the St. Lawrence River. Proceedings of the 1979 Oil Spill Conference. 1979:333-340.
- Atlas, R.M., A. Horowitz, M. Krichevsky, and A.K. Bej. 1991. Response of microbial populations to environmental disturbance. Microbial Ecology. 22:249-256.
- Bender, M.E., E.A. Shearls, and R.P. Ayres. 1977. Ecological effects of experimental oil spills on eastern coastal plain estuarine ecosystems. Proceedings 1977 International Oil Spill Conference. 1977:505-509.
- Bolton, H. Jr., J.K. Fredrickson, S.A. Bentjen, D.J. Workman, S.W. Li, and J.M. Thomas. 1991. Field calibration of soil-core microcosms: Fate of a genetically altered rhizobacterium. Microbial Ecology. 21:163-173.
- Burdick, D.M., I.A. Mendelssohn, and K.L. McKee. 1989. Live standing crop and metabolism of the marsh grass Spartina patens as related to edaphic factors in a brackish, mixed marsh community in Louisiana. Estuaries. 12:195-204.
- Burns, K.A., and J.M. Teal. 1979. The West Falmouth oil spill: Hydrocarbons in the salt marsh ecosystem. Estuarine and Coastal Marine Science. 8:349-360.
- Chabreck, R.H. 1970. Marsh zones and vegetative types of the Louisiana coastal marshes. Ph.D. Dissertation. Louisiana State University. Baton Rouge Louisiana. 112 pp.
- Chalmers, A.G. 1982. Soil dynamics and the productivity of Spartina alterniflora. In V.S. Kennedy (ed.), Estuarine Comparisons. Academic Press: New York, pp. 231-242.
- Cunningham, J.M., K.A. Sahatjian, C. Meyers, G. Yoshioka, and J.M. Jordan. 1991. Use of dispersants in the United States: Perception or reality? Proceedings of the 1991 Oil Spill Conference. 1991:389-393.
- de la Cruz, A.A. and C.T. Hackney. 1989. Temporal and spatial patterns of redox potential (Eh) in three tidal marsh communities. Wetlands. 9(2):181-190.
- DeLaune, R.D., W.H. Patrick, Jr., and R.J. Buresh. 1979. Effect of crude oil on a Louisiana Spartina alterniflora salt marsh. Environmental Pollution. 1979:21-31.
- DeLaune, R.D., G.A. Hambrick, and W.H. Patrick, Jr. 1980. Degradation of hydrocarbons in oxidized and reduced sediments. Marine Pollution Bulletin. 11:103-106.
- DeLaune, R.D., C.J. Smith, and W.H. Patrick, Jr. 1983. Relationship of marsh elevation, redox potential, and sulfide to Spartina alterniflora productivity. Soil Sci. Soc. Am. J. 47:930-935.
- DeLaune, R.D., C.J. Smith, W.H. Patrick, Jr., J.W. Fleeger, and M.D. Tolley. 1984. Effect of oil on salt marsh biota: Methods for restoration. Environmental Pollution (A). 36:207-227.
- DeLille, D., and R. Siron. 1993. Effect of dispersed oil on heterotrophic bacterial communities in cold marine waters. Microbial Ecology. 25:263-273.
- Dicker HJ, Smith DW (1985) Effects of organic amendments on sulfate reduction activity, H2 consumption, and H2 production in salt marsh sediments. Microb Ecol. 11:299-315.
- EPA. 1991. Alaska Oil Spill Bioremediation Project Science Advisory Board Draft Report. Environmental Research Laboratory, Office of Research and Development, U.S. Environmental Protection Agency, Sabine Island, Gulf Breeze, Florida.
- Faulkner, S.P., W.H. Patrick, Jr., and R.P. Gambrell. 1989. Field techniques for measuring wetland soil parameters. Soil Sci. Soc. Am. J. 53:883-890.
- Feijtel, T.S., R.D. DeLaune, and W.H. Patrick, Jr. 1988. Seasonal porewater dynamics in marshes of Barataria Basin, Louisiana. Soil Sci. Soc. Am. J. 52:59-67.
- Fiocco, R.J., Canevari, J.B. Wilkinson, H.O. Jahns, J. Bock, M. Robbins, and R.K. Markarian. 1991. Development of COREXIT 9580: A chemical beach cleaner. Proc. 1991. Oil Spill Conf. American Petroleum Institute, Washington D.C. 1991:395-400.
- Fleeger, J.W., and G.T. Chandler. 1983. Meiofauna responses to an experimental oil spill in a Louisiana salt marsh. Marine Ecology Progress Series. 11:257-264.
- Fiocco, R.J., G.P. Canevari, J.B. Wilkinson, H.O. Jahns, J. Bock, M. Robbins, and R.K. Markarian. 1991. Development of COREXIT 9580: A chemical beach cleaner. Proceedings of the 1991 Oil Spill Conference. 1991:395-400.
- Good, R.E., N.F. Good, and B.R. Frasco. 1982. A review of primary production and decomposition dynamics of the belowground marsh component. In: V.S. Kennedy (ed.), Estuarine Comparisons. Academic Press, pp. 139-157.
- Hambrick, G.A., R.D. DeLaune, and W.H. Patrick, Jr. 1980. Effect of estuarine sediment pH and oxidation-reduction potential on microbial hydrocarbon degradation. Applied and Environmental Microbiology. 40:365-369.
- Jackson, A.W., J.H. Pardue, and R. Araujo. 1996. Monitoring crude oil mineralization in salt marshes: Use of stable carbon isotope ratios. Environ. Sci. Technol. 30:1139-1144.
- Karl, D.M. 1992. The grounding of the Bahia Paraiso: Microbial ecology of the 1989 Antarctic oil spill. Microbial Ecology. 24:77-89.
- Klerks, P.L., and J.A. Nyman. in press. The interaction between oil spills, chemical responses, and fresh marsh types in determining toxicity to indigenous aquatic animals and the detail of hydrocarbon analyses required to predict this toxicity, Year II. Louisiana Applied Oil Spill Research and Development Program, OSRADP Technical Report Series.
- Kludze H.K, and R.D. DeLaune. 1995. Straw application effects of methane and oxygen exchange and growth in rice. Soil Sci Soc Am J. 59:824-830.
- Knox, G.A. 1986. Estuarine ecosystems: A systems approach. Volume II. CRC Press, Inc: Boca Raton FL.
- Kroer, N., and R.B. Coffin. 1992. Microbial trophic interactions in aquatic mesocosms designed for testing genetically engineered microorganisms: A field comparison. Microbial Ecology. 23:143-157.
- La DNR. 1991. Louisiana energy statistics, 1909-1989. Center for Energy Studies, 1 E. Fraternity Circle, LSU. Baton Rouge LA.
- Li, Y., J.T. Morris, and D.C. Yoch. 1990. Chronic low level hydrocarbon amendments stimulate plant growth and microbial activity in salt-marsh microcosms. J. Applied Ecology. 27:159-171.
- Lin, Q. and I. A. Mendelssohn. 1996. A comparative investigation of the effects of South Louisiana Crude oil on the vegetation of fresh, brackish, and salt marshes. Marine Pollution Bulletin. 32: 202-209.
- McKee, K.L., and I.A. Mendelssohn. 1989. Response of a freshwater marsh plant community to increased salinity and water level. Aquat. Bot. 34:301-316.
- Mendelssohn, I.A., M.W. Hester, and J.M. Hill. 1993. Assessing the recovery of coastal wetlands from oil spills. Proceedings 1993 International Oil Spill Conference. 1993:141-145.
- Mitsch, W.J., and J.G. Gosselink. 1984. Wetlands. Van Nostrand Reinhold Co.: New York.
- Moron, M.A., and R.E. Hodson. 1992. Contributions of three subsystems of a freshwater marsh to total bacterial secondary productivity. Microbial Ecology. 24:161-170.
- Nyman, J.A. 1999. Effects of crude oil and chemical additives on metabolic activity of mixed microbial populations in fresh marsh soils. Microbial Ecology. 37:152-162.
- Nyman, J.A., and W.H. Patrick, Jr. 1995. Effects of oil and chemical responses on fresh marsh function and oil degradation: Response implications. Louisiana Oil Spill Coordinator's Office/Office of the Governor, Louisiana Applied Oil Spill Research and Development Program, Baton Rouge, Louisiana. 68 pp.
- Padgett, D.E., and D.A. Celio. 1990. A newly discovered role for aerobic fungi in anerobic salt marsh soils. Mycologia. 82:791-794.
- Pezeshki, R.S., and R.D. DeLaune. 1993. Effect of crude oil on gas exchange functions of Juncus roemerianus and Spartina alterniflora. Water, Air, and Soil Pollution. 68:461-468.
- Pezeshki, S.R., R.D. DeLaune, J. A. Nyman, R. R. Lessard, G. P. Canevari, 1995. Removing oil and saving oiled marsh grass using a shoreline cleaner. International Oil Spill Conf., Amer. Petrol. Inst., Publ. No., 4620, pp. 203-209.
- Sanders, H.L., J.F. Grassle, G.R. Hampson, L.S. Morse, S. Garner-Price, and C.C. Jones. 1980. Anatomy of an oil spill: Long-term effects from the grounding of the barge Florida off West Falmouth, Massachusetts. Journal of Marine Research. 38(2):265-380.
- Smith, C.J., R.D. DeLaune, W.H. Patrick, Jr., and J.W. Fleeger. 1984. Impact of dispersed and undispersed oil entering a Gulf Coast salt marsh. Environmental Toxicology and Chemistry. 3:609-616.
- Steele, R.G.D., and J.H. Torrie. 1980. Principles and procedures of statistics: A biometrical approach. Second Edition. McGraw-Hill, Inc., New York. 633 pp.
- Stotzky, F. 1997 Quantifying the metabolic activity of microbes in soil. In: Hurst CJ, Knudsen GR, McInerney MJ, Stetzenback LD, Walter WV (eds.), Manual of Environmental Microbiology. American Society for Microbiology, Washington D.C., pp 453-458.
- Swannell, R.P.J., A. Basseres, K. Lee, and F.X. Merlin. 1994. A direct respirometric method for the in situ determination of bioremediation efficacy. In: Proceedings of the Seventeenth Arctic and Marine Oil Spill Program (AMOP) technical seminar. Technology Development Directorate, Environmental Protection Service, Environment Canada. Ottawa, Ontario, Canada, pp. 1273-1286.
- Tate, R.L. 1980 Microbial oxidation of organic matter of histosols. Adv Microb Ecol. 4:169-201.
- US DOE. 1993. Petroleum Supply Annual 1992. Energy Information Administration, Office of Oil and Gas, U.S. Dept. of Energy. Washington D.C.
- Venosa, A.D., M. Kadkhodayan, D.W. King, B.A. Wrenn, J.R. Haines, T. Herrington, K Strohmeier, M.T. Suidan. 1993. Testing the efficacy of oil spill bioremediation products. Proc. 1993 International Oil Spill Conf. 1993:487-493.
- Webb, J.W., G.T. Tanner, and B.H. Koerth. 1981. Oil spill effects on smooth cordgrass in Galveston Bay, Texas.
9.0 Tables
Table 1. Experimental design of research. Each cell contained duplicate soils from three sites for a total sample size of 144. Sampling frequency for soil Eh, CO2 emissions, and CH4 emission were Days 1, 3, 7, 14, 28 (1 month), 56 (2 months), 98 (3.5 months), 140 (5 months), and 168 (six months) following treatment additions.
**[One sample from two sites was refrigerated on Day One and Day 168 (six months) for analysis with GC/FID (N = 72)]**
| no crude oil |
South Louisiana Crude |
Alaskan North Slope Crude |
|
|---|---|---|---|
| Spartina alterniflora soil | |||
| no response | FID | FID | FID |
| cleaner | FID | FID | |
| dispersant | FID | FID | |
| fertilizer | FID | FID | |
| Juncus roemerianus soil | |||
| no response | FID | FID | FID |
| cleaner | FID | FID | |
| dispersant | FID | FID | |
| fertilizer | FID | FID | |
Table 2. Field soil characteristics (mean + sd) of Spartina alterniflora and Juncus roemerianus dominated saline marsh from three distinct geologic regions of coastal Louisiana: Chenier Plain - Rockefeller Wildlife Refuge (CP); Inactive Deltaic - LUMCON Cocodrie, Terrebonne Bay (ID); Active Deltaic - Old Oyster Bayou (AD).
| saline marsh |
bulk density (g/cm3) |
percent mineral |
mineral density (g/cm3) |
organic density (g/cm3) |
water density (g/cm3) |
percent water |
|---|---|---|---|---|---|---|
| Spartina alterniflora | ||||||
| CP | 0.35 (0.08) | 82 (4) | 0.29 (0.08) | 0.06 (0.01) | 0.74 (0.12) | 68 (3) |
| ID | 0.44 (0.17) | 86 (6) | 0.38 (0.16) | 0.06 (0.03) | 0.67 (0.09) | 61 (9) |
| AD | 0.48 (0.07) | 0.73 (0.09) | 60 (3) | |||
| Juncus roemerianus | ||||||
| CP | 0.43 (0.09) | 87 (1) | 0.37 (0.08) | 0.06 (0.01) | 0.59 (0.17) | 57 (5) |
| ID | 0.36 (0.12) | 82 (8) | 0.30 (0.11) | 0.06 (0.02) | 0.74 (0.08) | 67 (8) |
| AD | 0.47 (0.05) | 0.71 (0.08) | 60 (2) | |||
Table 3. Mean (standard deviation) of soil characteristics (mean + sd) from microcosms created with soil from three distinct geologic regions of coastal Louisiana: Chenier Plain - Rockefeller Wildlife Refuge (CP); Inactive Deltaic - LUMCON Cocodrie, Terrebonne Bay (ID); Active Deltaic - Old Oyster Bayou (AD).
| saline marsh |
bulk density (g/cm3) |
percent mineral |
mineral density (g/cm3) |
organic density (g/cm3) |
water density (g/cm3) |
percent water |
|---|---|---|---|---|---|---|
| saline marsh Spartina alterniflora | ||||||
| CP | 0.27 (0.02) | 83 (1) | 0.22 (0.02) | 0.05 (0.002) | 0.45 (0.06) | 40 (3) |
| ID | 0.40 (0.02) | 88 (1) | 0.36 (0.02) | 0.05 (0.001) | 0.38 (0.07) | 31 (4) |
| AD | 0.38 (0.004) | 90 (1) | 0.34 (0.004) | 0.04 (0.004) | 0.31 (0.05) | 28 (4) |
| Juncus roemerianus | ||||||
| CP | 0.34 (0.004) | 89 (1) | 0.30 (0.004) | 0.04 (0.004) | 0.44 (0.03) | 37 (2) |
| ID | 0.26 (0.003) | 83 (0.7) | 0.21 (0.004) | 0.04 (0.002) | 0.42 (0.02) | 38 (2) |
| AD | 0.44 (0.004) | 92 (3) | 0.41 (0.01) | 0.04 (0.01) | 0.41 (0.009) | 34 (0.7) |
Table 4. Loss of crude oils (percent weight) after weathering
| no response | dispersant | cleaner | |
|---|---|---|---|
| S. Louisiana | 13.6 | 22.4 | 12.3 |
| Alaskan N. Slope | 13.6 | 29.9 | 11.1 |
Table 5. Carbon additions and cumulative carbon emissions from microcosms to which crude oil was added and emissions then measured for 24 weeks.
| treatment | C added (g) | C emitted (g) |
|---|---|---|
| no oil | 0.0 | 0.10 (0.01) |
| Louisiana Crude | 1.4 | 0.18 (0.01) |
| Alaskan Crude | 1.4 | 0.19 (0.01) |
Table 6. Ranking of disturbance and hydrocarbon disappearance in saline marsh soils. Low rankings indicate more desirable effects; e.g., high hydrocarbon disappearance or low deviation from unoiled microcosms. Ties within a column indicate statistical similarity. The cumulative ranking is the product of the three factors evaluated: hydrocarbon disappearance, disturbance to microbial activity, and disturbance to soil Eh.
| soil | response | TPH rank |
microbial |
soil Eh rank |
cumulative rank |
|---|---|---|---|---|---|
| oyster grass | Fertilizer | 1 | 1 | 1 | 1 |
| needle rush | 1 | 2 | 1 | 2 | |
| oyster grass | no additive | 1 | 2 | 2 | 4 |
| needle rush | 1 | 2 | 2 | 4 | |
| oyster grass | cleaner | 1 | 2 | 3 | 6 |
| needle rush | 1 | 2 | 3 | 6 | |
| oyster grass | dispersant | 2 | 2 | 3 | 12 |
| needle rush | 2 | 2 | 3 | 12 |
10.0 Figures
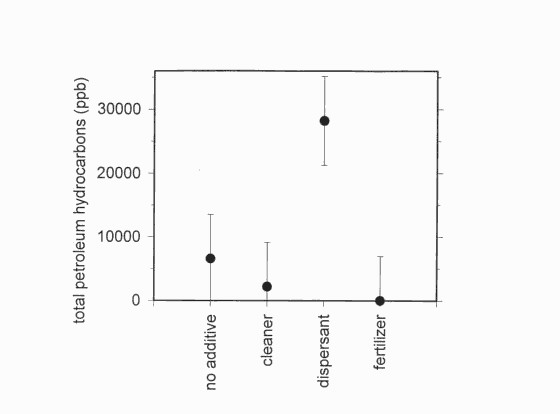
Figure 1. Total petroleum hydrocarbons 24 weeks after adding treatments.
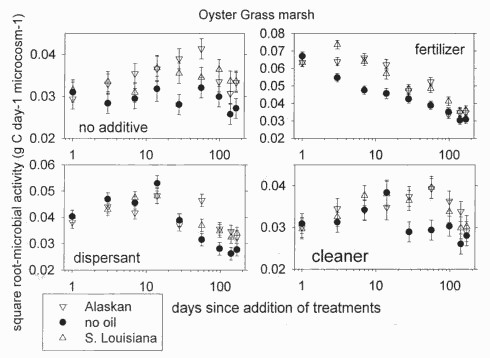 Figure 2. Microbial activity in oyster grass marsh after adding oils and chemicals.
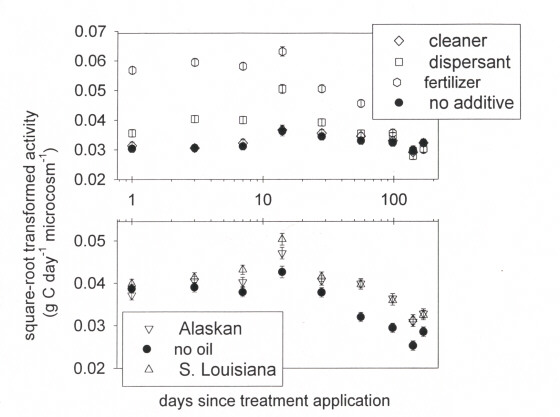 Figure 3. Microbial activity in needle rush marsh after adding oils and chemicals.
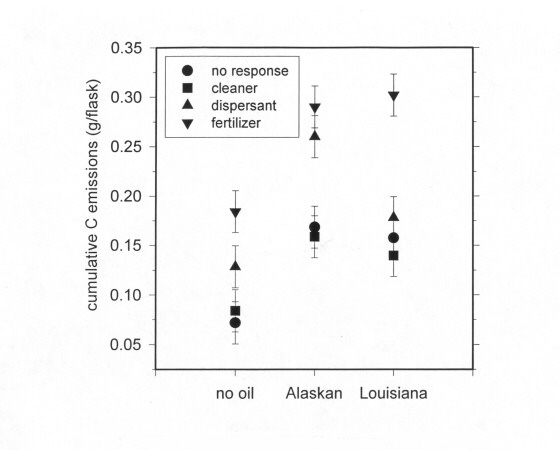 Figure 4. Cumulative carbon emissions from oiled oyster grass marsh microcosms.
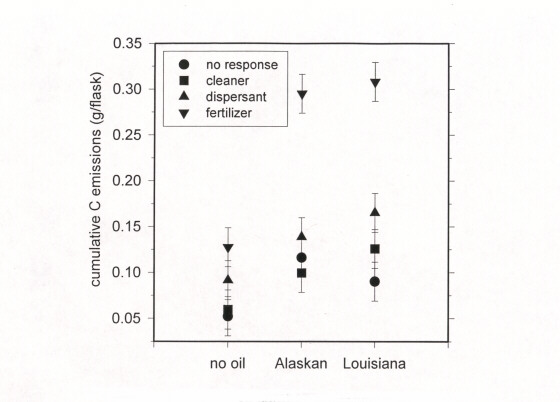
Figure 5. Cumulative carbon emissions from oiled needle rush marsh microcosms.
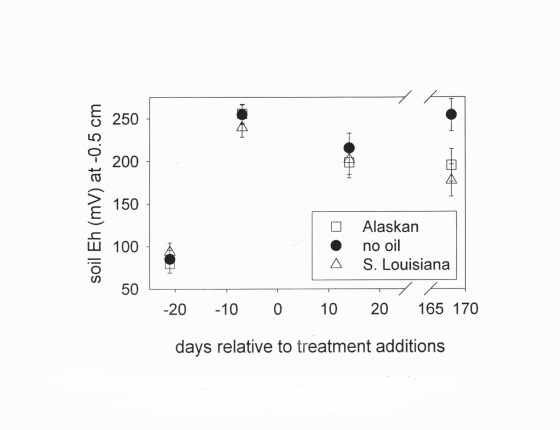 Figure 6. Eh 0.5 cm below the soil surface before and after adding crude oils.
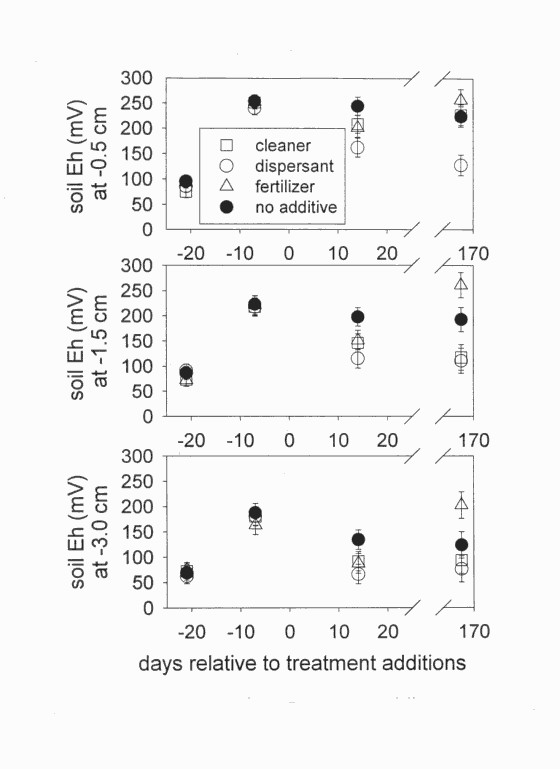
Figure 7. Soil Eh before and after adding chemicals.